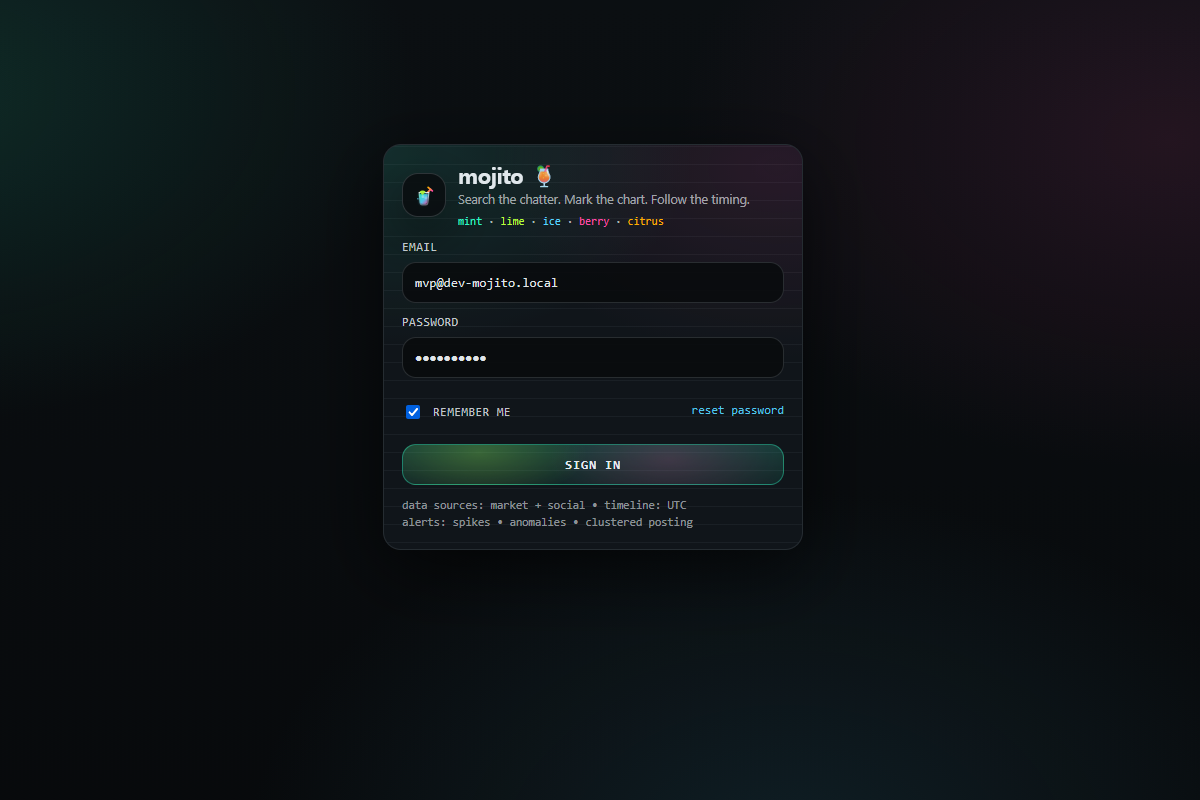
🍹 Mojito
A private analytics dashboard that overlays social posts mentioning a stock ticker onto a price chart, so you can see what was said and when it landed.
What it does
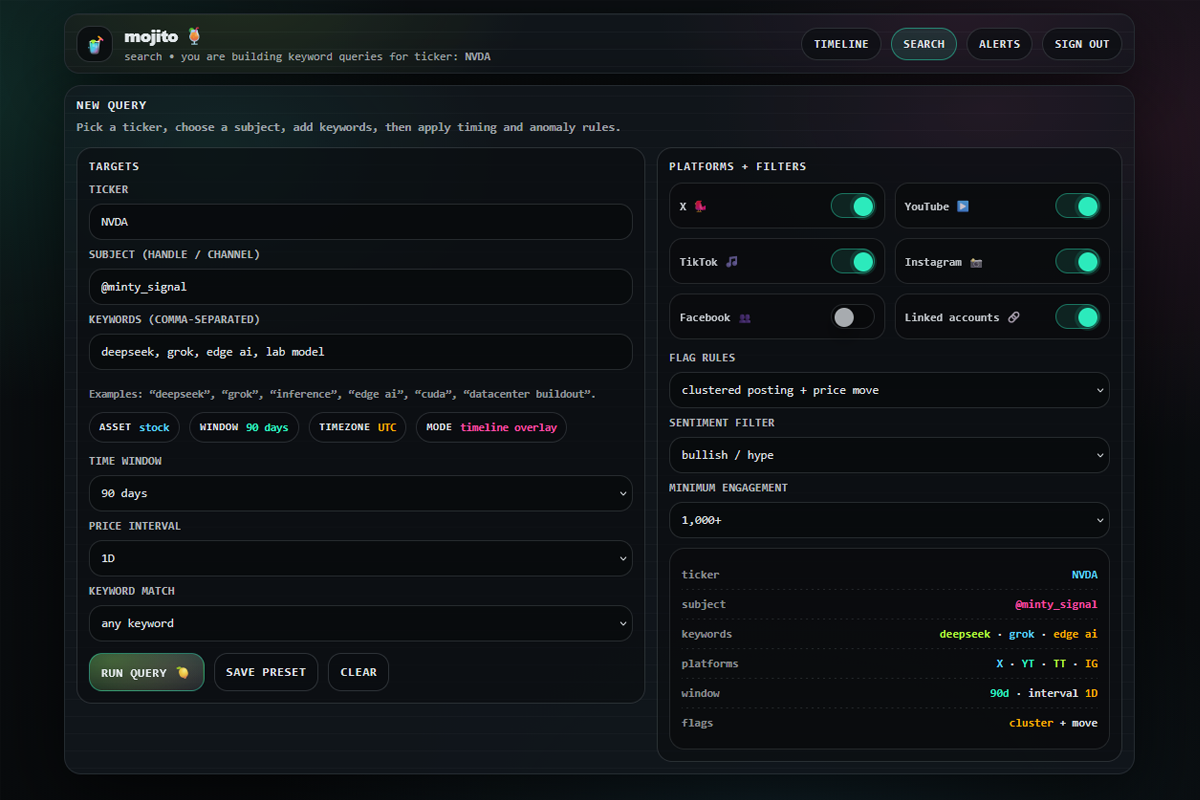
Mojito was built as a highly customised request: type a stock ticker and a social account, search for posts that mention the ticker, and then plot those posts directly onto the price chart at the time they were published.
- Ticker + account search to pull relevant posts that mention the chosen symbol.
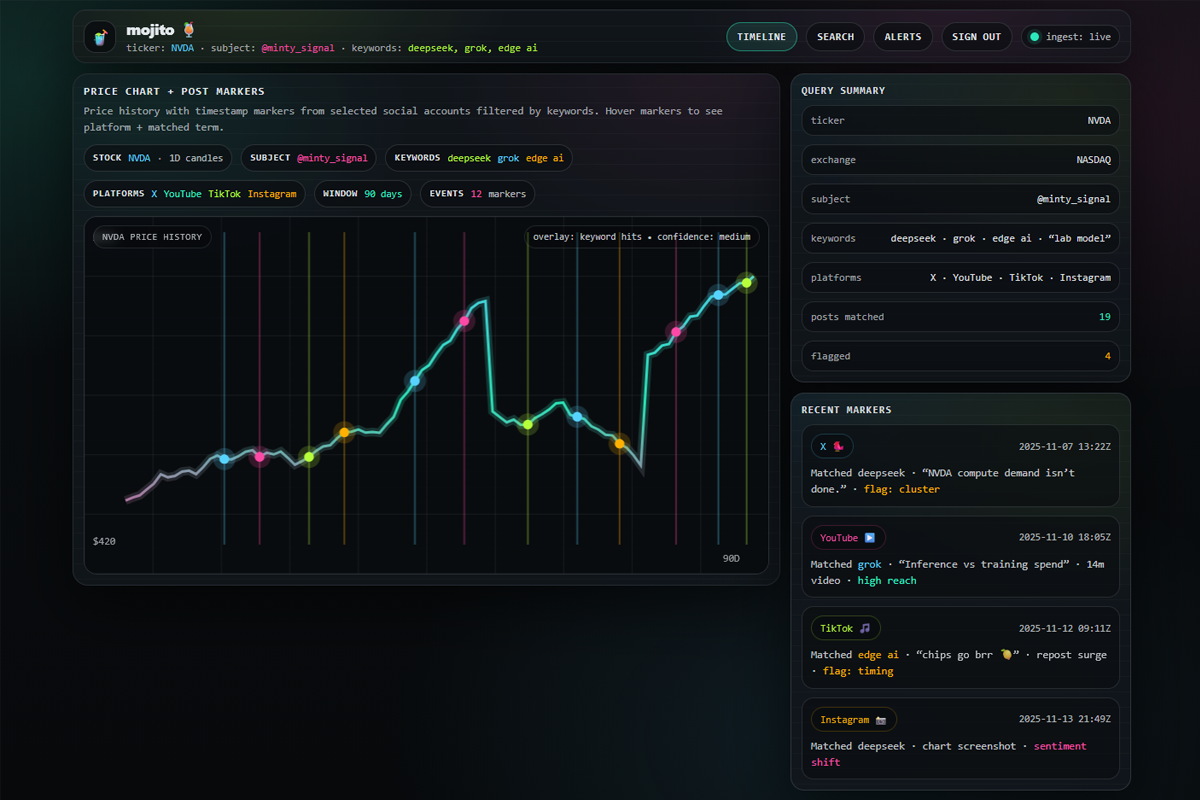
- Post-to-chart overlay so each mention becomes a timestamped marker on the price line.
- Fast filtering for date ranges, keywords, and “show me only the posts that mattered.”
- Clean, readable UI designed to feel calm even when the data is busy.
Tech stack
The priority was reliable data retrieval and a charting UI that felt polished. The app runs on a private host and is accessible exclusively to the client.
- Backend: Python + Flask (API routes, auth, scheduled fetch jobs).
- Data: SQLite / Postgres (depending on deployment) for searches, cached results, and settings.
- APIs: Free, publicly available APIs for market data and public social content sources.
- Frontend: HTML/CSS + JavaScript with interactive charting and markers.
- Deployment: Hosted externally with restricted access (private client environment).
What made it a “custom build”
The client didn’t want a generic dashboard. It had to be purpose-built around a specific workflow: search, correlate, and interpret the timeline quickly. It also had a strong design requirement. It had to look good while staying practical.