💲 FlowGlyph
A local-first “signal to context” dashboard that links high-volume prediction market activity to relevant news, then overlays headlines onto price/probability charts.
What it does
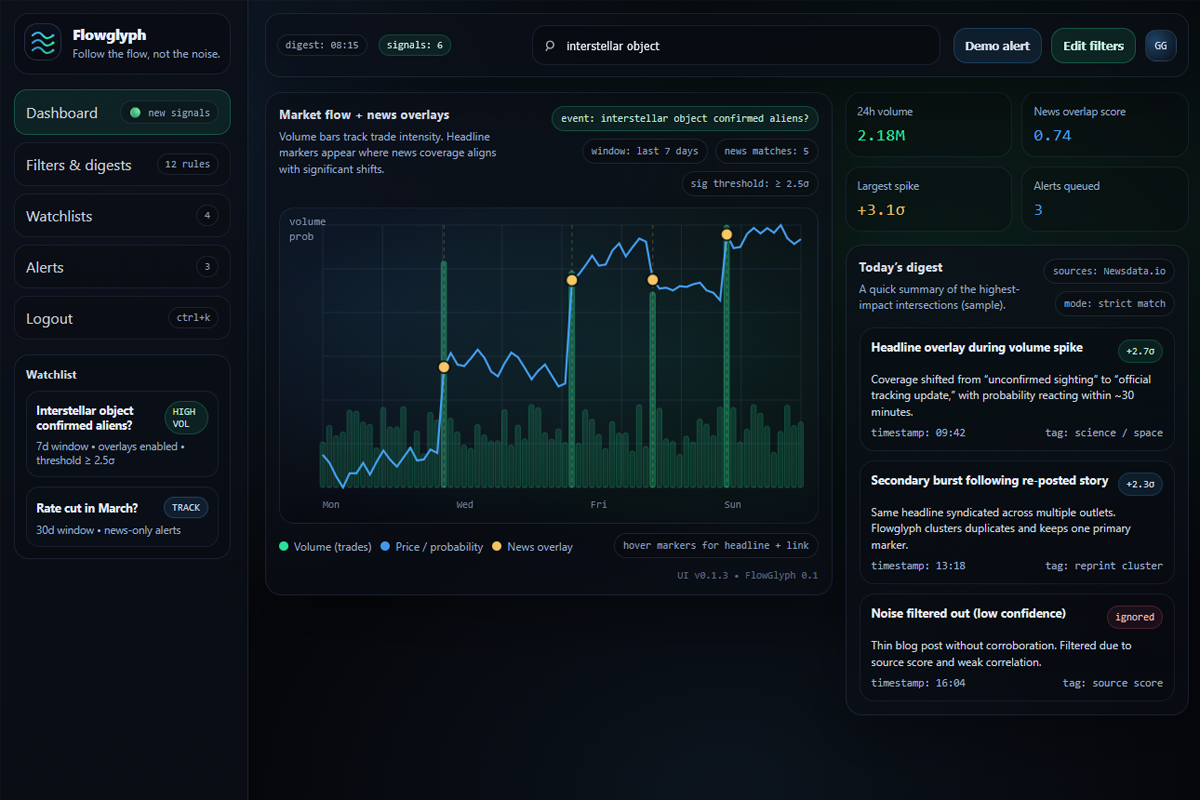
Flowglyph was designed for a simple question: “Why is this market moving right now?” The dashboard pulls a feed of high-volume trades and sudden probability shifts, lets the user pin the markets they care about, and then automatically searches for relevant coverage to explain the move.
- Trade + volume feed to surface unusual activity and fast-moving markets.
- News correlation by querying current coverage and clustering it by market/topic.
- Chart overlays that place headlines on the probability graph at the time they hit.
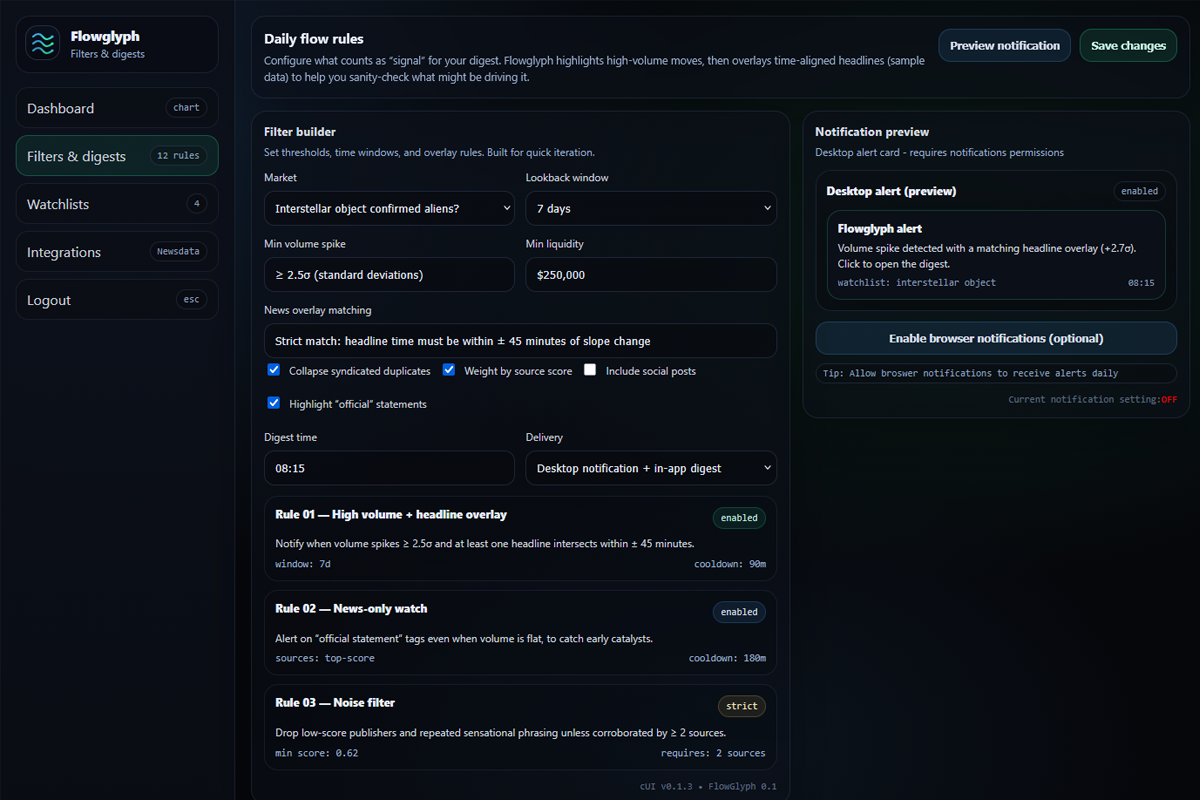
- Rules + filters so users can tune what “interesting” means (volume, velocity, keywords, sources).
- Local-first deployment so it can run on a desktop without needing a hosted backend.
Tech stack
The goal was lightweight deployment, quick iteration, and a UI that felt like a trading tool rather than a blog feed. The stack was chosen to run as a self-contained service on a single machine.
- Backend: Node.js (Express) for a local API and background polling jobs.
- Data: SQLite for local persistence (saved markets, rules, cached news results).
- Integrations: Polymarket API for market data, NewsData.io for article search.
- Frontend: Vanilla JS + Chart.js for interactive charting and overlays.
- Packaging: Runs as a local web server (optionally wrapped as a desktop app shell).
Notes on delivery
The original client paused the project before launch due to a change in direction. The implementation shown here reflects a “ready to productionise” build: core flows, rule logic, and chart overlays functioning end to end.